Office Address
14, Residency Road, Udaipur, Rajasthan 313001
Office Address
14, Residency Road, Udaipur, Rajasthan 313001

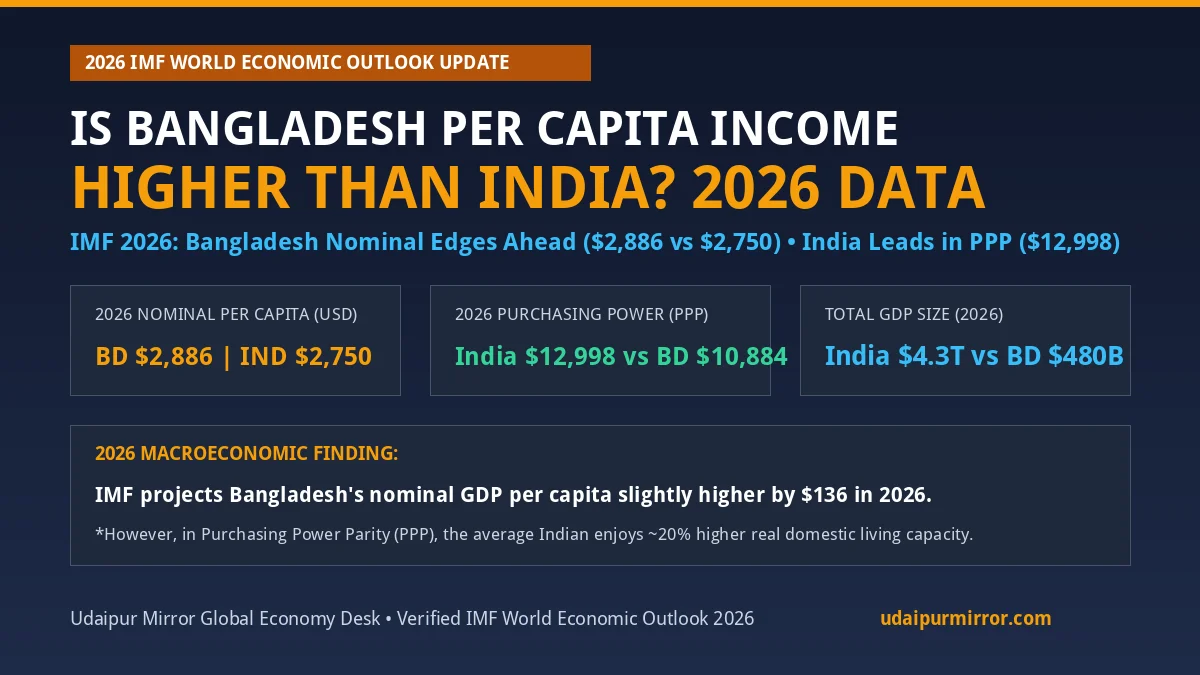
Over the past few years, one of the most fiercely debated macroeconomic topics across South Asia has centered on the provocative question: Is Bangladesh’s per capita income higher than India’s? According to recent projections from the International Monetary Fund (IMF) in its IMF DataMapper World Economic Outlook Database, Bangladesh’s nominal GDP per capita is projected to be slightly higher than India’s in 2026—standing at approximately $2,886 compared to India’s $2,750, representing a narrow margin of about $136. That statistical milestone continues to trigger widespread debate on economic governance, export competitiveness, and social indicators, drawing close parallels with India’s broader macroeconomic growth metrics.
However, headlines rarely capture the complete macroeconomic picture. To understand whether Bangladesh is truly richer than India on an individual level, one must examine the critical distinction between Nominal GDP per capita (which fluctuates heavily with currency exchange rates and population denominators) and Purchasing Power Parity (PPP) per capita (which reflects real living standards and domestic purchasing capacity), as well as the vast difference in total economic scale.
| Comparison Parameter | India (Bharat) | Bangladesh | 2026 Verdict & Real Meaning |
|---|---|---|---|
| 2026 Nominal GDP Per Capita (USD) | ~$2,750 – $2,813 | ~$2,886 – $2,911 | Bangladesh slightly higher by ~$136 in nominal USD (per IMF WEO projections). |
| 2026 PPP GDP Per Capita (Real Living Standard) | ~$12,998 International Dollars | ~$10,884 International Dollars | India leads by ~20%; average Indian has notably higher domestic purchasing power. |
| 2026 Total Nominal GDP (Economy Size) | ~$4.2 – $4.3 Trillion (5th Globally) | ~$480 – $510 Billion (35th Globally) | India is roughly 8.5 to 9 times larger in total economic output. |
| Medium-Term Projection (2027–2029) | Overtakes in nominal per capita by 2027 | Nominal growth stabilizes | IMF projects India will pull decisively ahead as 6.5–7% growth compounds. |
| Foreign Exchange Reserves | ~$690+ Billion (Near Record Highs) | ~$19 – $22 Billion (Under IMF Program) | India holds ~32 times larger foreign reserve buffer against global shocks. |
| Total Population Base | ~1.44 Billion | ~173 Million | India divides its massive GDP over 8.3 times more citizens. |
According to the latest International Monetary Fund (IMF) World Economic Outlook (WEO) datasets, Bangladesh’s nominal GDP per capita in 2026 is projected at $2,886 compared to India’s $2,750. Understanding why this happens requires looking at how nominal GDP is calculated:
Nominal per capita income is calculated by taking a nation’s total economic output in its domestic currency (Indian Rupee or Bangladeshi Taka), converting it into US Dollars at current market exchange rates, and dividing it by the total population. Because this metric depends heavily on the prevailing exchange rate of the US Dollar and population growth rates, it can swing significantly due to statistical adjustments rather than actual ground wealth.
India’s total economic output (~$4.2 Trillion) is distributed across a colossal population of 1.44 billion citizens, including expansive agrarian belts in central and northern India. Bangladesh, with a compact population of 173 million and a dense concentration of female wage earners in the readymade garment (RMG) export cluster, concentrates its economic output across a much smaller denominator, keeping its nominal per capita ratio slightly ahead in 2026 projections.
The same IMF projections that place Bangladesh slightly ahead in 2026 also indicate that India will regain a definitive lead starting in 2027–2028. As India’s rapid 6.5% to 7.2% annual economic expansion compounds and heavy capital investments in manufacturing and infrastructure mature, India’s per capita income will pull decisively ahead over the medium to long term.
While nominal dollar comparisons make viral headlines, economists universally agree that Purchasing Power Parity (PPP) provides the truest measure of individual living standards and domestic purchasing capacity. PPP adjusts for local price levels, cost of living, and inflation differences—accounting for what a basket of everyday goods, healthcare, housing, and food actually costs in local terms.
On a PPP-adjusted basis, the comparison is stark and unambiguous:
An average Indian citizen enjoys substantially higher purchasing capacity for domestic goods, digital services, healthcare, and infrastructure. India’s per capita income in PPP terms has never fallen behind Bangladesh at any point in modern economic history.
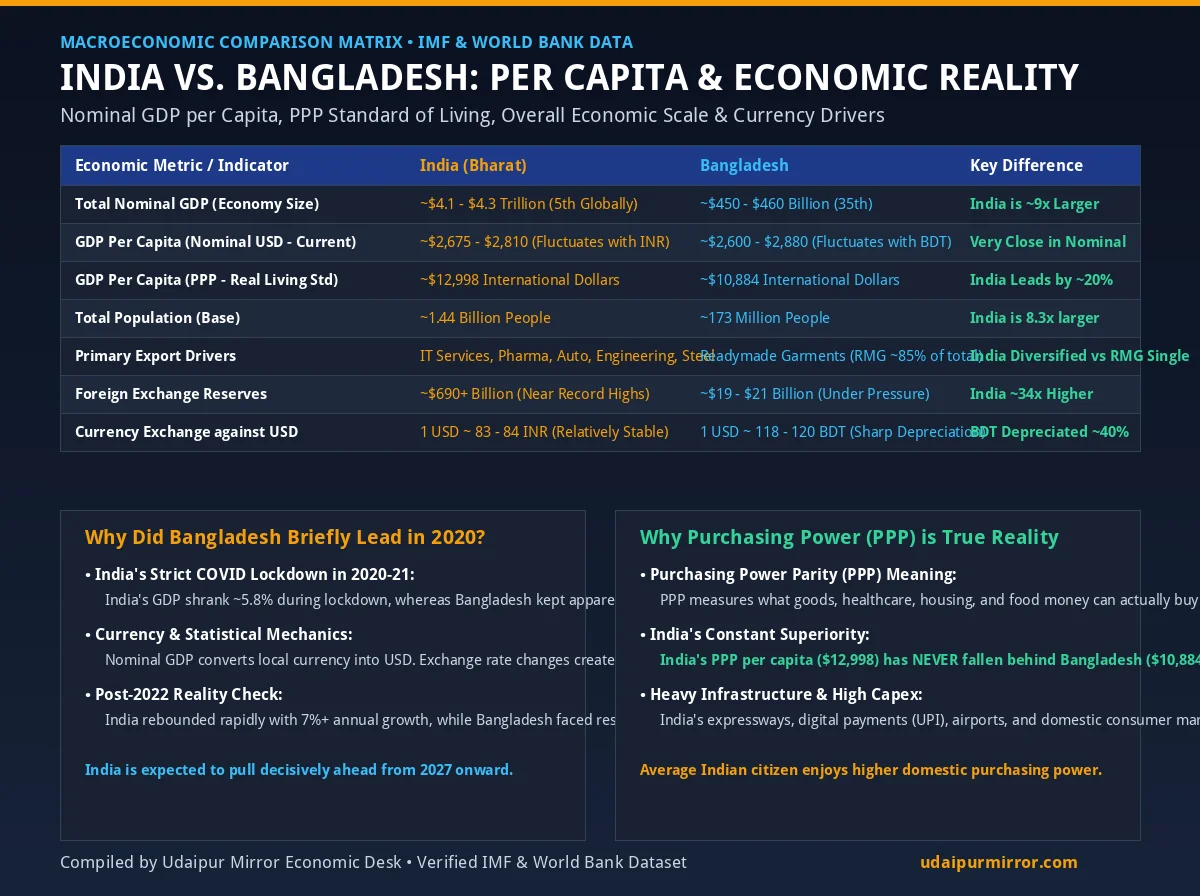
The initial debate first erupted during the COVID-19 pandemic due to specific structural circumstances:
Following the pandemic, India rapidly closed the gap and surged ahead, supported by massive infrastructure expansion and industrial policy developments covered across Udaipur Mirror National News.
| Feature / Sector | India’s Economic Engine (2026) | Bangladesh’s Economic Engine (2026) |
|---|---|---|
| Export Diversification | Highly Diversified: Software/IT services ($320B+), refined petroleum, engineering goods, pharmaceuticals, automobiles, electronics, and chemicals. | Extreme Concentration: Readymade garments (RMG) account for over 83% to 85% of all export earnings. Highly vulnerable to global fashion demand shifts. |
| Digital Infrastructure & Fintech | World-leading digital public infrastructure (Unified Payments Interface – UPI, Aadhaar, DigiLocker), processing billions of real-time transactions monthly. | Pioneered microfinance (Grameen Bank) and mobile financial services (bKash), but formal banking faces high non-performing loans (NPLs). |
| Domestic Consumer Market | Massive middle-class domestic market of 1.44 billion people that shields the economy during global trade downturns. | Relatively smaller domestic consumer market (173 million); overwhelmingly reliant on external trade and overseas remittances. |
| Social & Labor Indicators | Rapidly improving in maternal health and higher education, but faces significant regional disparities between southern and northern states. | Historically excelled in female workforce participation (over 38% vs India’s ~32%), lower child mortality, and higher female literacy in garment clusters. |
Official IMF Primary Data Source & Reference:
All nominal GDP per capita data and 2026 projections cited in this analysis are sourced directly from the official International Monetary Fund (IMF) World Economic Outlook (WEO) comparative portal: https://www.imf.org/external/datamapper/NGDPDPC@WEO/IND/BGD.
Yes. According to recent projections from the International Monetary Fund (IMF), Bangladesh’s nominal GDP per capita is projected at approximately $2,886 in 2026 compared to India’s $2,750—a minor difference of about $136.
No. In total economic scale, India’s GDP (~$4.2 to $4.3 Trillion) is roughly 8.5 to 9 times larger than Bangladesh’s (~$480 to $510 Billion). Furthermore, in real living standards measured by Purchasing Power Parity (PPP), the average Indian is approximately 20% richer ($12,998 vs $10,884).
IMF medium-term projections indicate that India will pull ahead in nominal GDP per capita starting in 2027–2028, expanding its lead through the end of the decade as compounding 6.5% to 7% GDP growth outpaces Bangladesh.
2026 में क्या बांग्लादेश की प्रति व्यक्ति आय भारत से अधिक है? जानिए आईएमएफ के नवीनतम आंकड़े और जमीनी सच्चाई
अंतरराष्ट्रीय मुद्रा कोष (IMF) के नवीनतम वर्ल्ड इकोनॉमिक आउटलुक (WEO) 2026 के अनुमानों के अनुसार, नॉमिनल आधार पर वर्ष 2026 में बांग्लादेश की प्रति व्यक्ति जीडीपी भारत से थोड़ी अधिक रहने का अनुमान है। अंतरराष्ट्रीय मुद्रा कोष के आधिकारिक पोर्टल (IMF DataMapper WEO) के अनुसार, 2026 में बांग्लादेश की नॉमिनल प्रति व्यक्ति आय लगभग $2,886 डॉलर रहने का अनुमान है, जबकि भारत की लगभग $2,750 डॉलर रहने का अनुमान है—यानी दोनों के बीच करीब $136 डॉलर का मामूली अंतर है।
निष्कर्ष: आईएमएफ के 2026 अनुमानों में नॉमिनल डॉलर के आधार पर बांग्लादेश करीब $136 डॉलर की मामूली बढ़त पर है, लेकिन वास्तविक जीवन स्तर (PPP), डिजिटल अधोसंरचना (UPI), मजबूत विदेशी मुद्रा भंडार, और कुल आर्थिक शक्ति में भारत का दबदबा निर्विवाद रूप से कायम है, और 2027 से भारत नॉमिनल आंकड़ों में भी आगे निकल जाएगा।
Add Udaipur Mirror as a preferred source on Google to see more of our travel guides in your AI overviews.





Comments are closed.

[…] Daily | सरस्वती लाइब्रेरी जल संकट 2 seconds ago ⚡ Business Is Bangladesh Per Capita Income Higher Than India? Facts, IMF Data & Real Comparison E… News Udaipur Permanent Lok Adalat Penalizes Bank for Withholding Fixed Deposit Payout Despite […]