Office Address
14, Residency Road, Udaipur, Rajasthan 313001
Office Address
14, Residency Road, Udaipur, Rajasthan 313001


UDAIPUR: UDAIPUR — For Indian retail investors constructing long-term wealth portfolios through systematic investment plans, evaluating nifty 50 vs nifty next 50 index funds has become a primary cornerstone of modern mutual fund allocation in November 2026. While the bellwether Nifty 50 index provides unshakeable exposure to India’s top fifty giant-cap corporations, the Nifty Next 50 index targets the subsequent bracket of high-growth potential businesses ranked 51 to 100 by full market capitalization. Understanding the underlying structural differences, cyclical volatility profiles, and optimal asset splits is essential for maximizing post-tax wealth accumulation without inviting excessive market drawdowns.
⚡ Quick Highlights: Nifty 50 vs Nifty Next 50 Index Funds 2026: SIP Guide
The foundational difference between the two indices lies in market capitalization ranking on the National Stock Exchange. The Nifty 50 holds the undeniable heavyweight champions of Indian commerce—industry titans with deep economic moats, massive free-float market capitalizations, and steady cash flows across economic cycles. Conversely, the Nifty Next 50 holds companies ranked 51st to 100th, representing high-growth enterprises that are often on the verge of transitioning into giant-cap status. When analyzing emerging corporate trends, financial planners note that Next 50 firms frequently exhibit higher agility and revenue expansion rates.
Sectoral representation also diverges significantly between the two baskets. While Nifty 50 is heavily weighted toward banking, financial services, and information technology, Nifty Next 50 provides robust exposure to fast-moving consumer goods, specialty chemicals, healthcare, and industrial manufacturing. Investors seeking household brand diversity often find that combining both funds eliminates single-sector concentration risks while capturing broad-based economic growth. (Also read: Rajasthan Palanhar Yojana 2026: Monthly Financial Assistance for Children, Eligibility & Online Form).
“The Nifty Next 50 is arguably the most dynamic index in India, housing tomorrow's blue-chips before they enter institutional radar screens.” — Senior Wealth Strategist
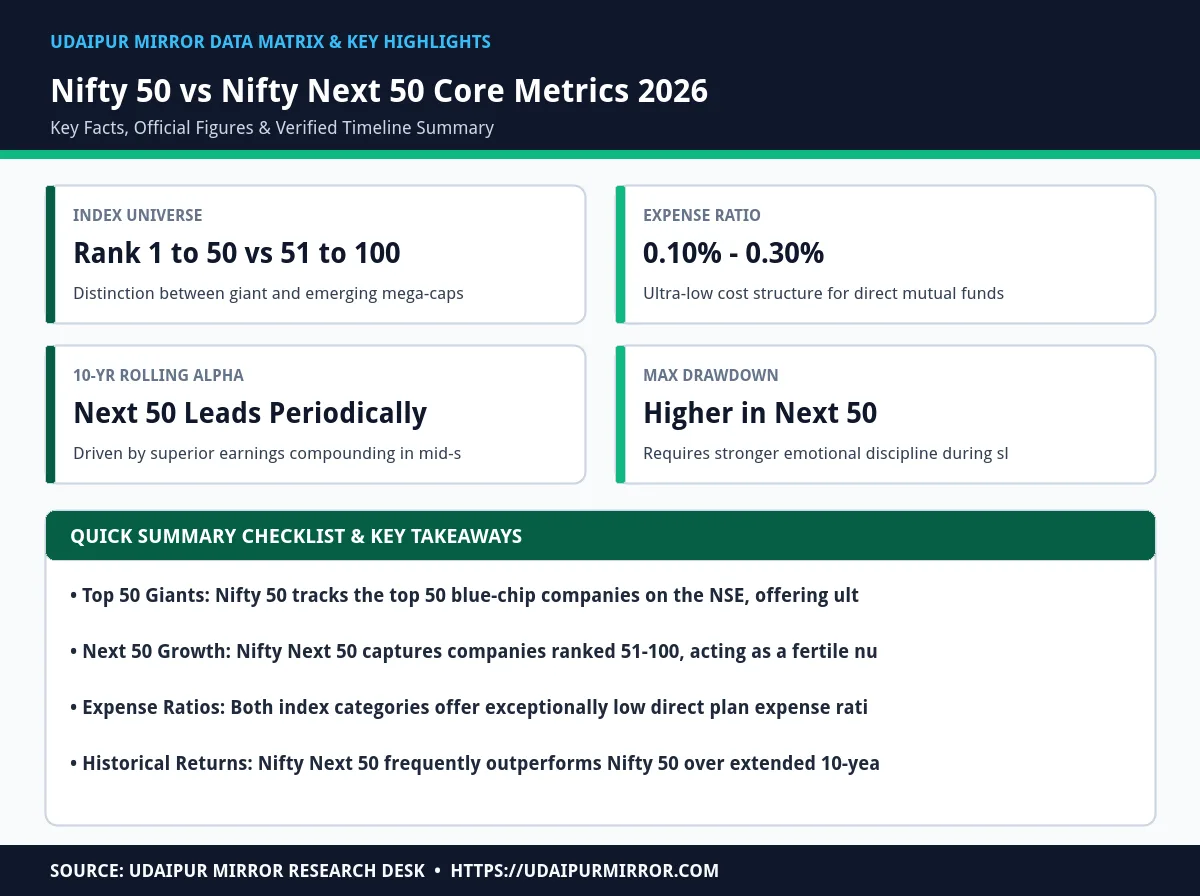
Review this structured tabular breakdown to analyze the core structural, risk, and performance parameters that differentiate giant-cap Nifty 50 funds from emerging mega-cap Nifty Next 50 funds.
| Parameter | Nifty 50 Index Fund | Nifty Next 50 Index Fund | Combined Synergy |
|---|---|---|---|
| Market Cap Segment | Giant-Cap (Top 1–50) | Potential Mega-Cap (Rank 51–100) | Complete Top 100 NSE Universe |
| Average Expense Ratio | 0.10% – 0.22% | 0.15% – 0.30% | Minimal drag on long-term SIPs |
| Volatility & Drawdown | Moderate, defensive | Higher, aggressive | Balanced portfolio beta |
| Dividend Yield | Generally higher (1.2% – 1.5%) | Generally lower (0.6% – 1.0%) | Blended cash flow generation |
| Primary Sector Focus | Financial Services, IT, Energy | Consumer Goods, Pharma, Industrials | Comprehensive sectoral diversification |
| Ideal Investor Profile | Conservative to Moderate | Aggressive & Long-Term | All lifecycle investor stages |
Over extended 10-year rolling return windows, empirical data demonstrates that Nifty Next 50 index funds frequently match or outperform the Nifty 50, albeit with cyclical divergence. During phases of broad economic expansion, the superior earnings growth of mid-tier giants translates into remarkable alpha. However, this outperformance is not linear; the Next 50 can experience prolonged consolidation phases when market sentiment turns defensive.
Risk-adjusted metrics such as the Sharpe and Sortino ratios reveal that Nifty 50 generally provides a smoother ride with superior risk-adjusted efficiency during turbulent years. For disciplined retail investors running monthly SIPs, this cyclical interplay works to their advantage through rupee cost averaging, allowing accumulation of units at lower valuations during temporary market dips. For families managing household savings, understanding these cycles is as essential as reviewing government welfare support systems for long-term financial security.
“Historical data underscores that patience is the ultimate currency when investing in the Nifty Next 50 index.” — Quantitative Research Desk
Market corrections test the emotional fortitude of every retail investor. Because Nifty Next 50 companies carry higher growth expectations and slightly lower institutional liquidity compared to top-tier blue-chips, they experience magnified drawdowns during macroeconomic shocks. A typical 15% market correction in the broader benchmark can easily translate into a 22% to 25% drawdown in the Next 50 index.
Investors must align their psychological risk tolerance with their portfolio construction. Those who panic-sell during bear phases destroy their long-term compounding potential. Recognizing that drawdowns are a temporary feature of high-growth index investing allows investors to maintain their automated SIP commitments without disruption. (Also read: Rayta Hills & Nandeshwar Udaipur Guide 2026: Monsoon Road Trip, Misty Green Valleys & Travel Tips).
One of the greatest tailwinds for Indian mutual fund investors in 2026 is the exceptionally low cost of passive investing. Direct growth index funds tracking both the Nifty 50 and Nifty Next 50 boast expense ratios between 0.10% and 0.30%. By eliminating active fund manager bias and high portfolio churn, investors retain a significantly higher percentage of gross market returns.
Over a 15-to-20-year wealth accumulation horizon, saving even 1% annually in management fees translates into lakhs of rupees in compounding gains. Choosing direct plans via registered fintech platforms or mutual fund utilities ensures zero distributor commission drag.
Determining the ideal asset allocation between Nifty 50 and Nifty Next 50 depends heavily on an investor’s age, investment horizon, and risk appetite. For young earners in their 20s and 30s with a 15-to-25-year horizon, an aggressive split of 60% Nifty 50 and 40% Nifty Next 50 harnesses maximum compounding growth from emerging mega-caps.
Conversely, for investors approaching retirement or those with conservative risk profiles, a more defensive 70:30 or 80:20 allocation heavily anchored in Nifty 50 giant-caps provides capital preservation alongside modest inflation-beating returns. Rebalancing once annually ensures the portfolio adheres to target risk parameters.
Nifty 50 invests in the top 50 giant-cap companies on the NSE representing maximum stability, while Nifty Next 50 invests in companies ranked 51 to 100, offering higher growth potential but greater volatility.
Yes. Nifty Next 50 companies experience sharper drawdowns and higher volatility during market corrections because they carry higher growth valuations and slightly smaller market capitalizations than top blue-chips.
A popular and effective allocation for long-term wealth creation is a 70:30 or 60:40 split, depending on your age and risk tolerance—allocating more to Nifty 50 for stability and Nifty Next 50 for alpha generation.
Direct plan index funds tracking the Nifty 50 and Nifty Next 50 typically carry ultra-low expense ratios ranging between 0.10% and 0.30%, ensuring minimal drag on your long-term compounding.
Add Udaipur Mirror as a preferred source on Google to see more of our travel guides in your AI overviews.






[…] Tirth 2026: Black Marble Idol, Daily Aarti Timings & Saffron Puja Rules 5 seconds ago ⚡ Articles Nifty 50 vs Nifty Next 50 Index Funds 2026: Risk, Returns, Expense Ratio & Best SIP Al… Articles Rajasthan Palanhar Yojana 2026: Monthly Financial Assistance for Children, Eligibility […]
[…] Tirth 2026: Black Marble Idol, Daily Aarti Timings & Saffron Puja Rules 28 minutes ago ⚡ Articles Nifty 50 vs Nifty Next 50 Index Funds 2026: Risk, Returns, Expense Ratio & Best SIP Al… Articles Rajasthan Palanhar Yojana 2026: Monthly Financial Assistance for Children, Eligibility […]
[…] Tirth 2026: Black Marble Idol, Daily Aarti Timings & Saffron Puja Rules 2 hours ago ⚡ Articles Nifty 50 vs Nifty Next 50 Index Funds 2026: Risk, Returns, Expense Ratio & Best SIP Al… Articles Rajasthan Palanhar Yojana 2026: Monthly Financial Assistance for Children, Eligibility […]